Left Side (NSC): Focuses on security and long-term accumulation, using icons for "Compounding Growth," a safe for "Tax Savings" (specifically mentioning Section 80C), and graphs representing the "Fixed Rate" and "Locked 5-Year Term." Right Side (RBI Bonds): Highlights the modern features, with a prominent icon and arrow showing the direct "+0.35%" link to NSC, symbolizing the "Floating Rate." It also visualizes the "Regular Cash Flow" (bi-annual payouts on Jan 1 and July 1) and the "Variable Rate" dynamic.
Uncategorized

The Battle of the Sovereigns: NSC vs. RBI Floating Rate Bonds

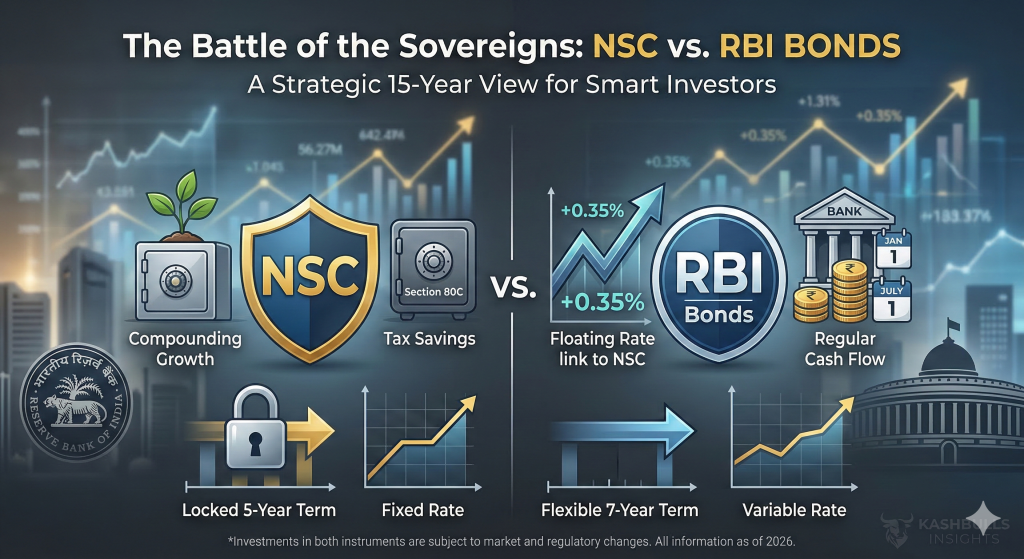
By Kulpreet Singh | Kashbulls Insights When you are looking for the ultimate “Safety First” investment in India, two names […]